Dashboards
PopSQL Team
February 3rd, 2020

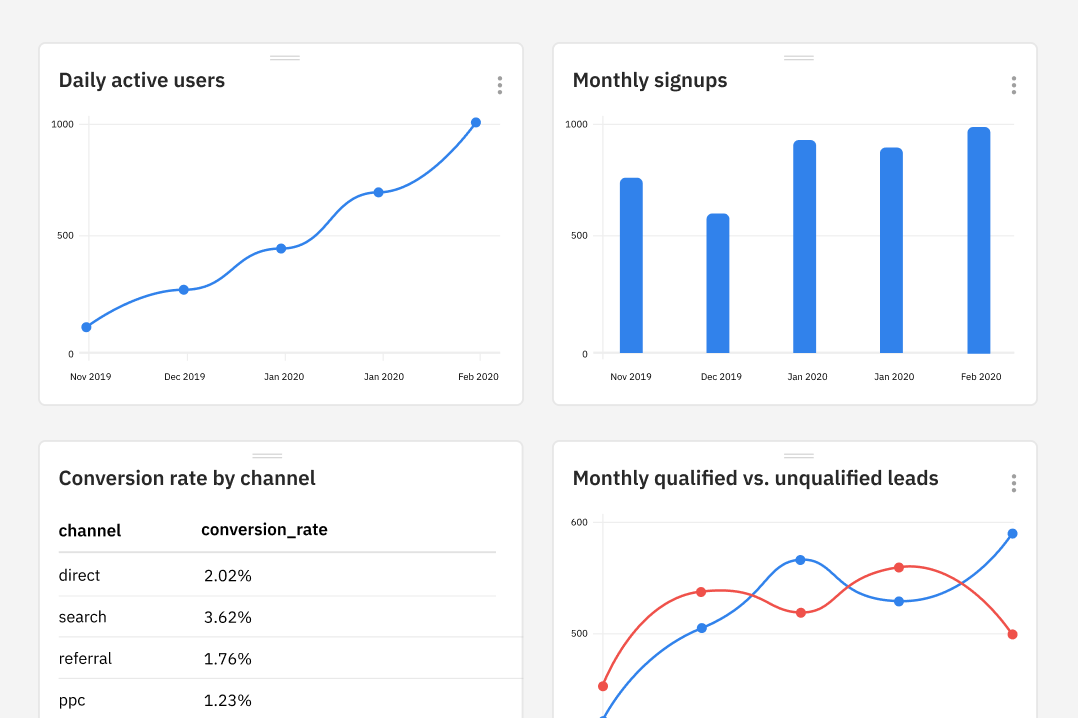
With dashboards, you can see your key metrics at a glance. Add multiple queries and visualizations to a dashboard to stay informed on key metrics.
Choose whether to view the results as data or an auto-generated chart. Then rearrange and resize the results however you’d like. And with query variables, you can refresh the entire dashboard with a click (view data by day or by week).
Perfect for weekly reports, product launches, marketing campaigns, sales growth, database health... any metric that matters to your team!
This feature is available now for Premium Team users. Please see our docs on dashboards for full information - enjoy! 📊
