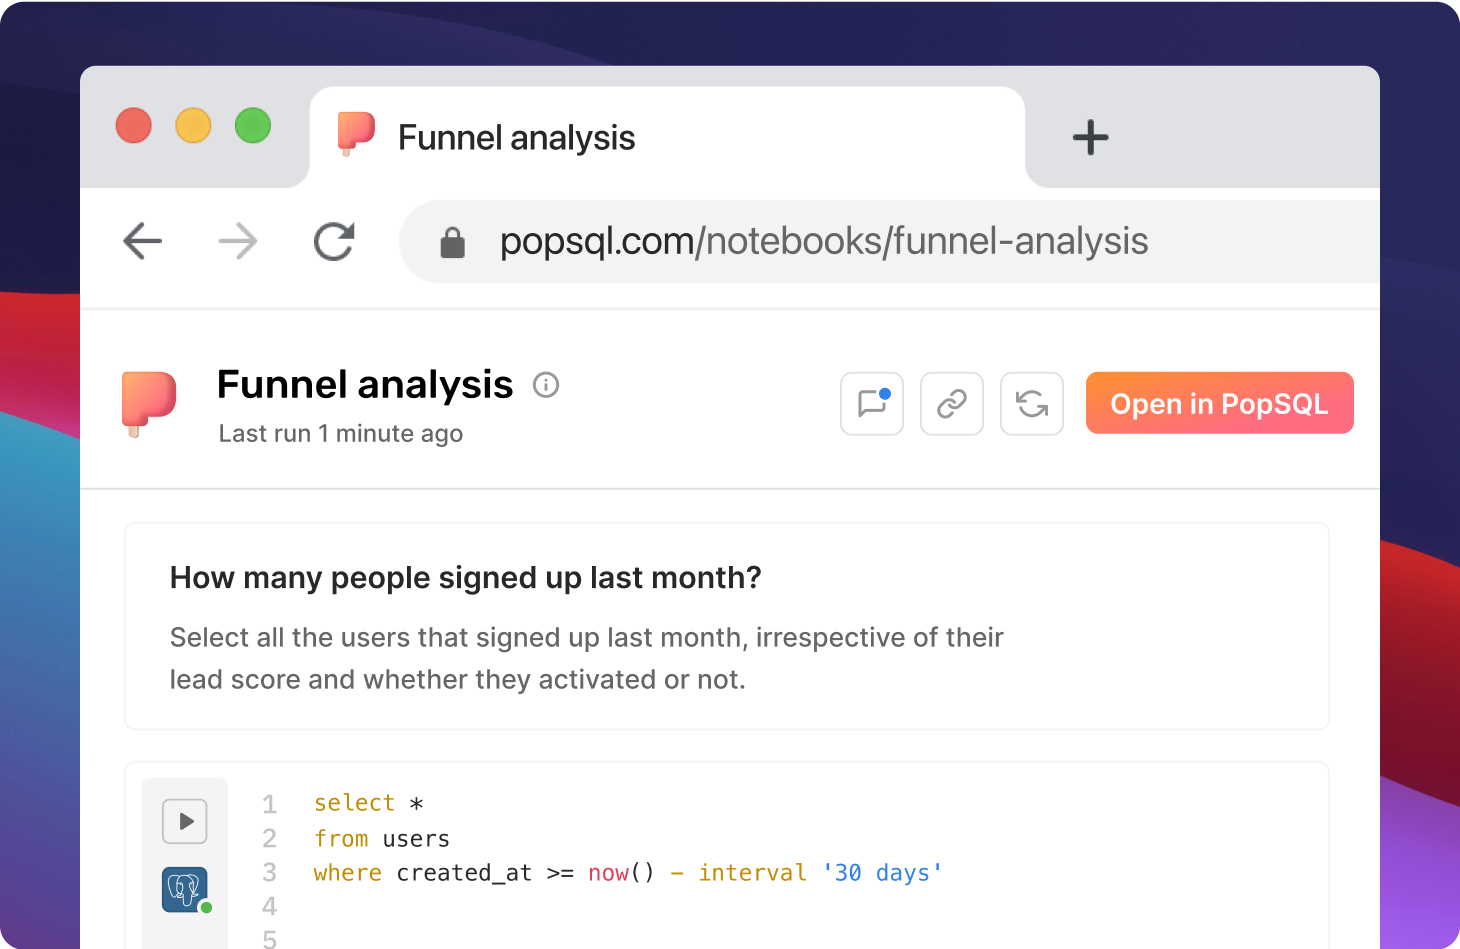
Introducing SQL Notebooks
Tell stories using data
Answering a business question is never just a single SQL query. It requires multiple queries, data tables, charts, slicing and dicing, and text explanations. Notebooks let you tell a story using data.
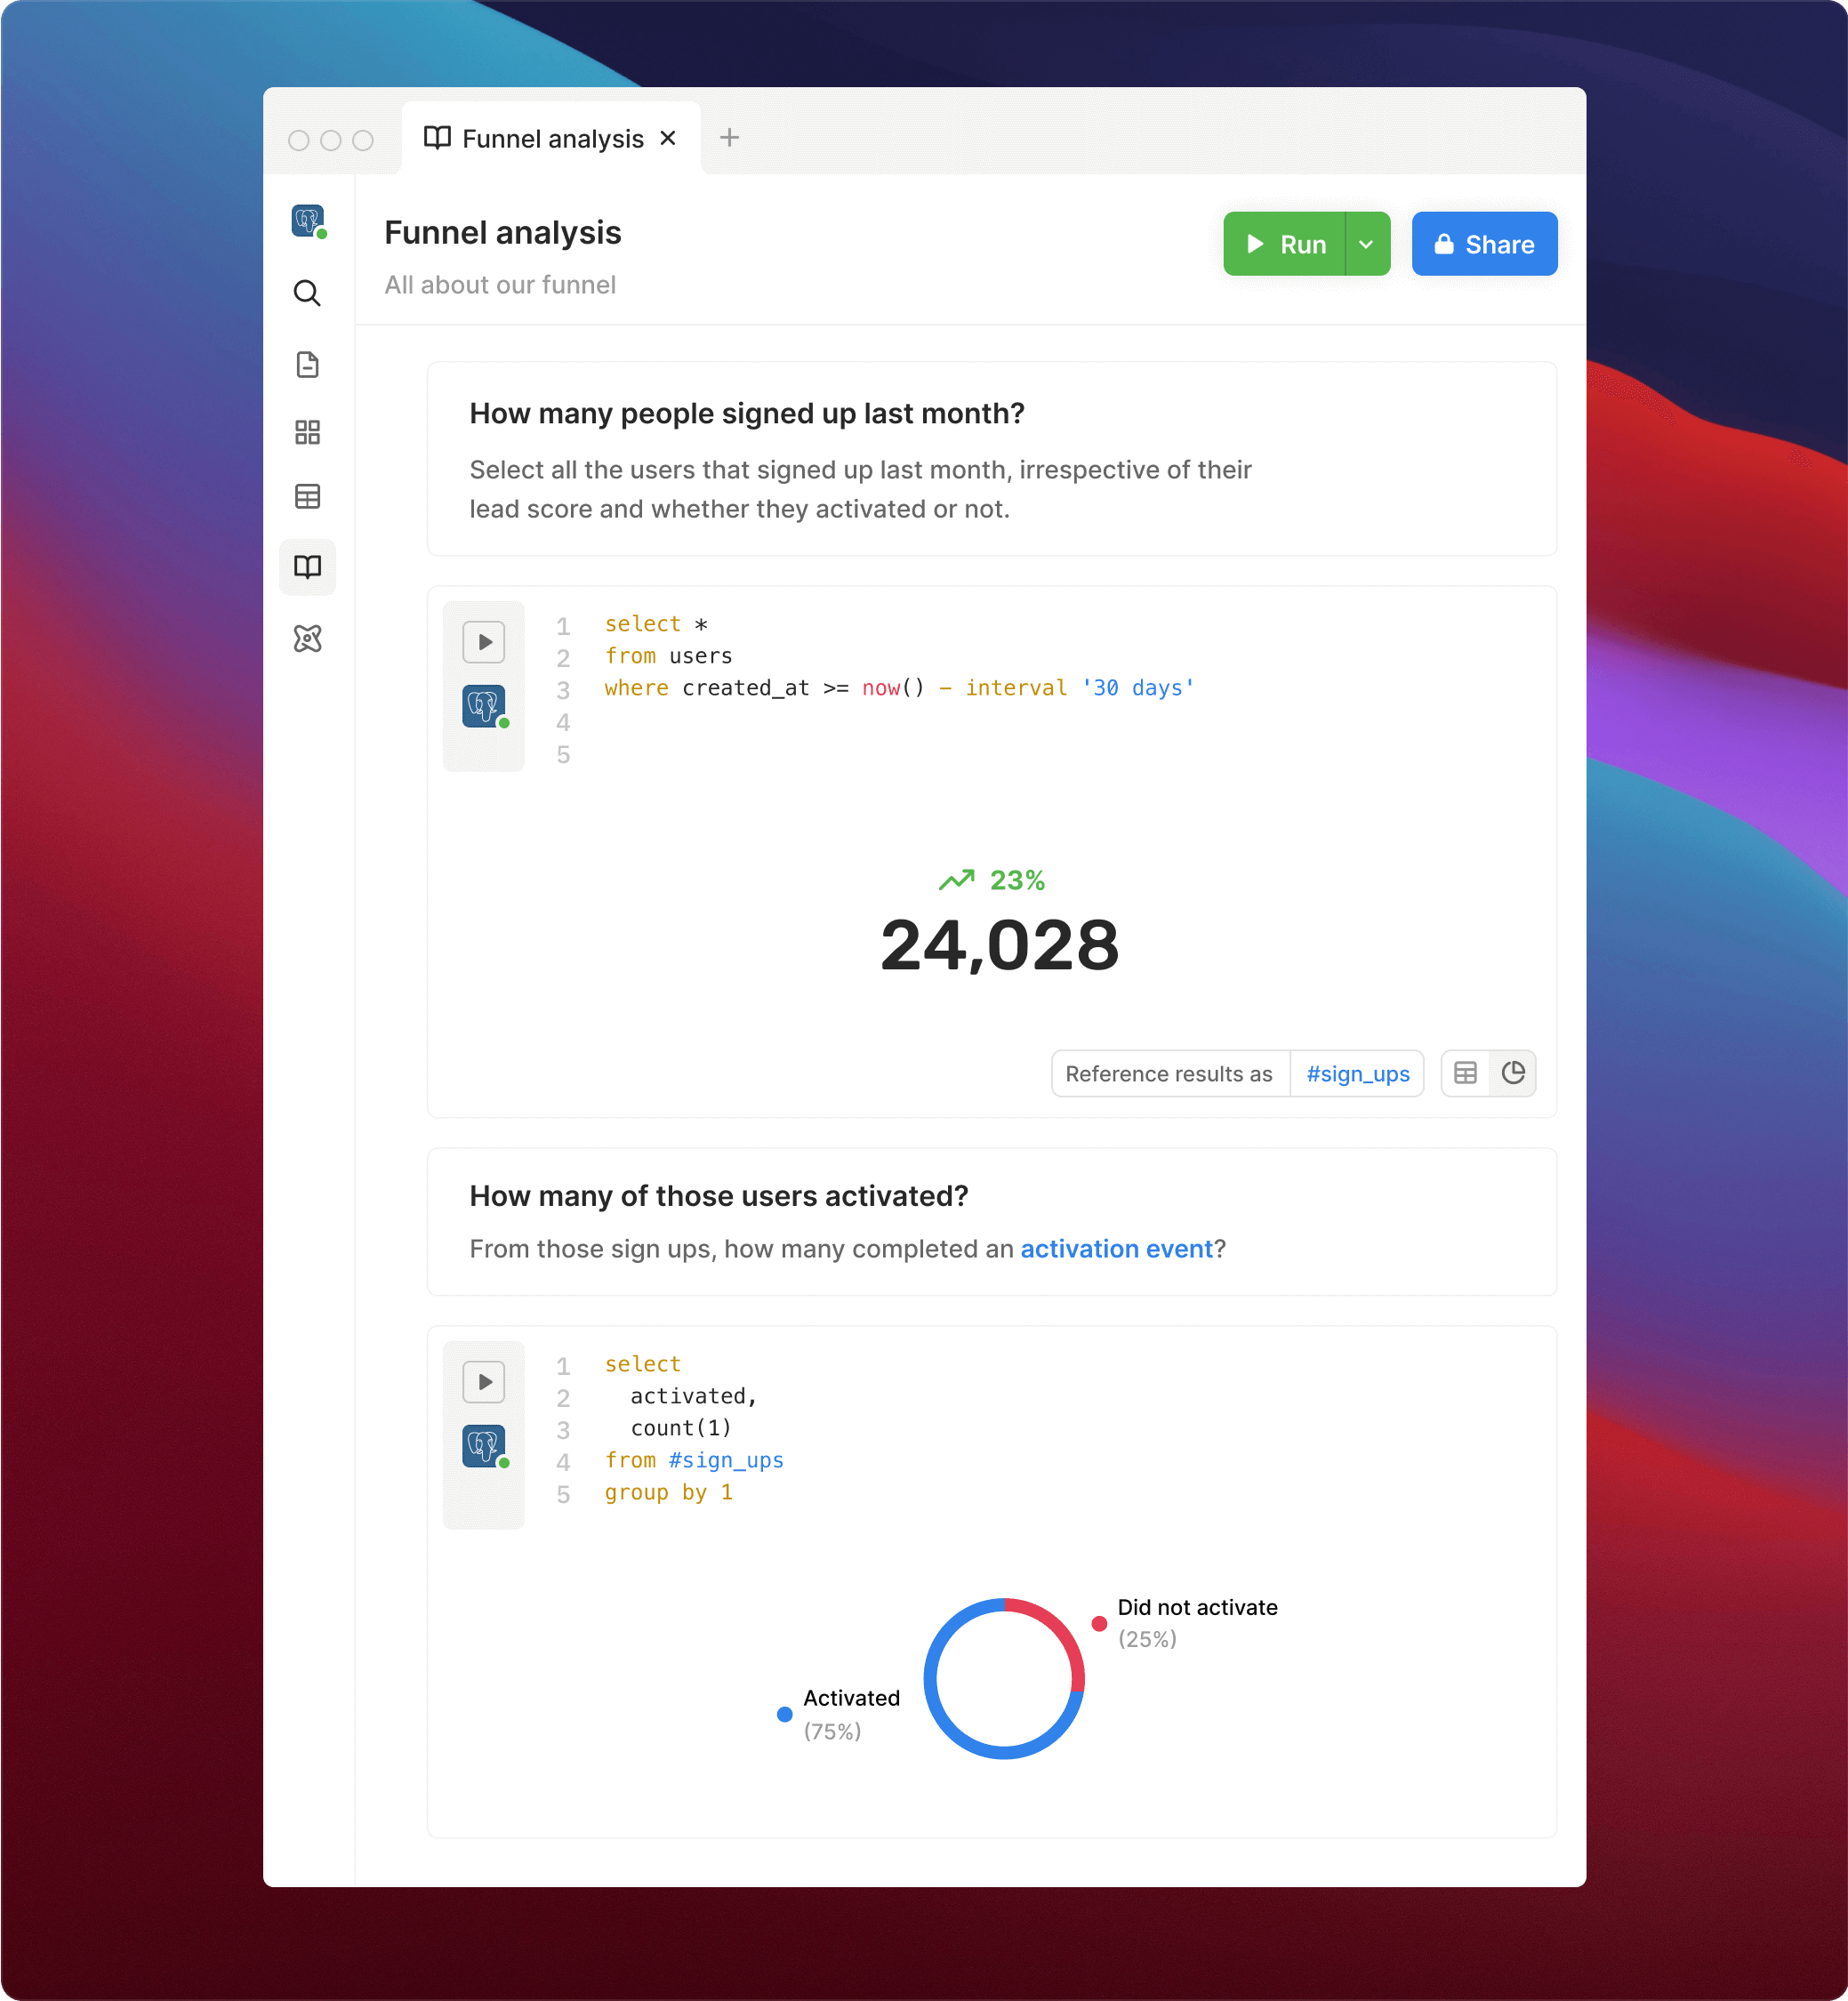
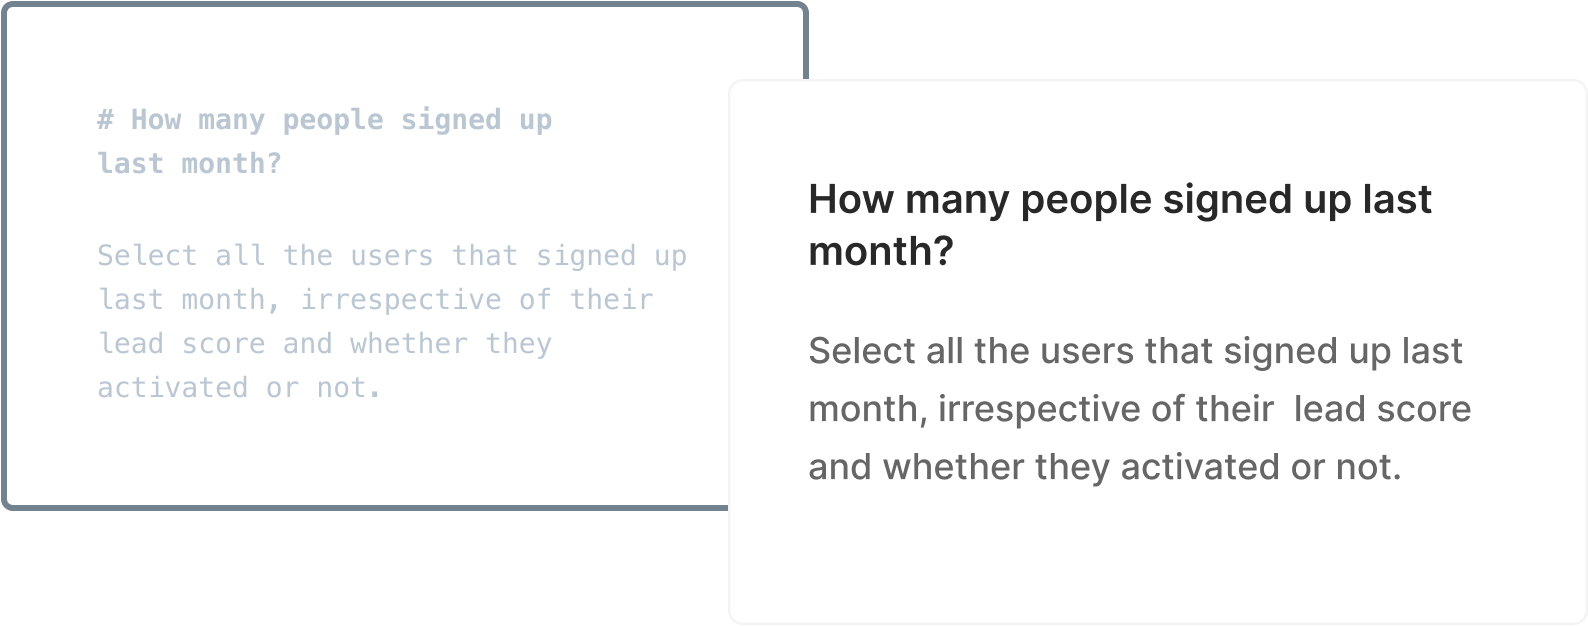
Explain your analysis with text
Write an intro paragraph, document assumptions, and state your conclusion, all using Markdown.
Support your story with data
Add as many queries and charts as you want to support your story.
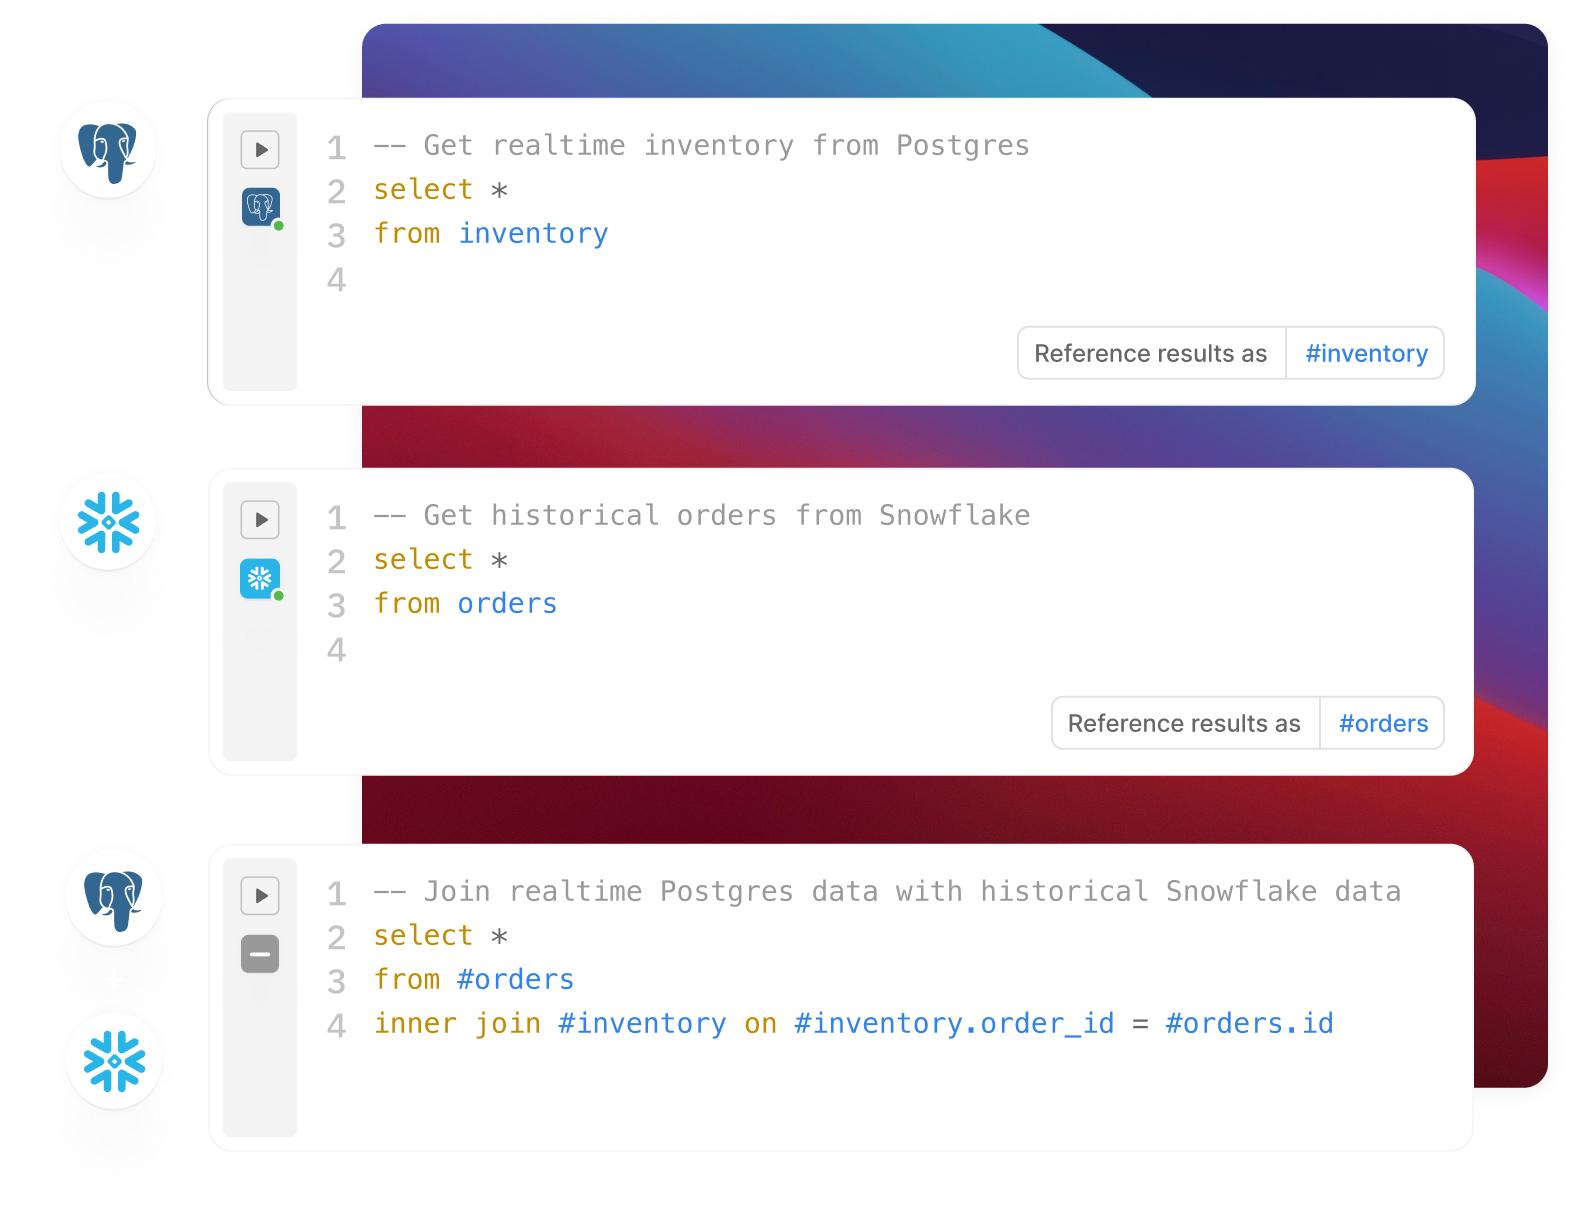
Join data across multiple sources
Sometimes your data lives in different sources, like Postgres and Snowflake. Notebooks let you join them together.
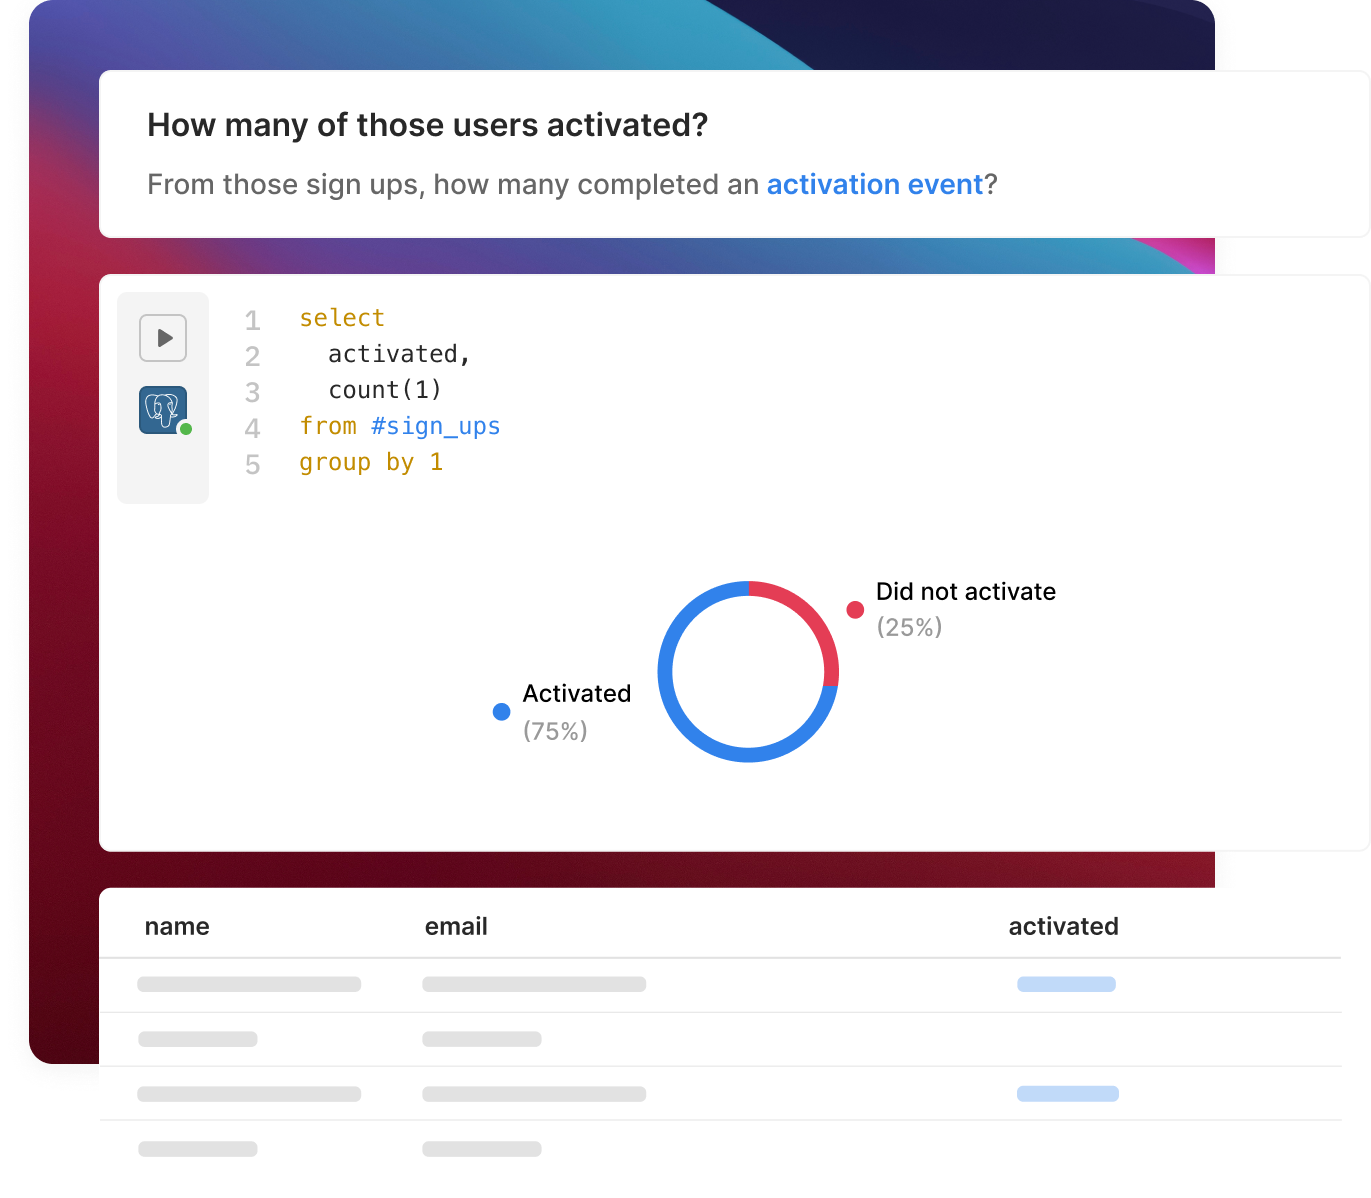
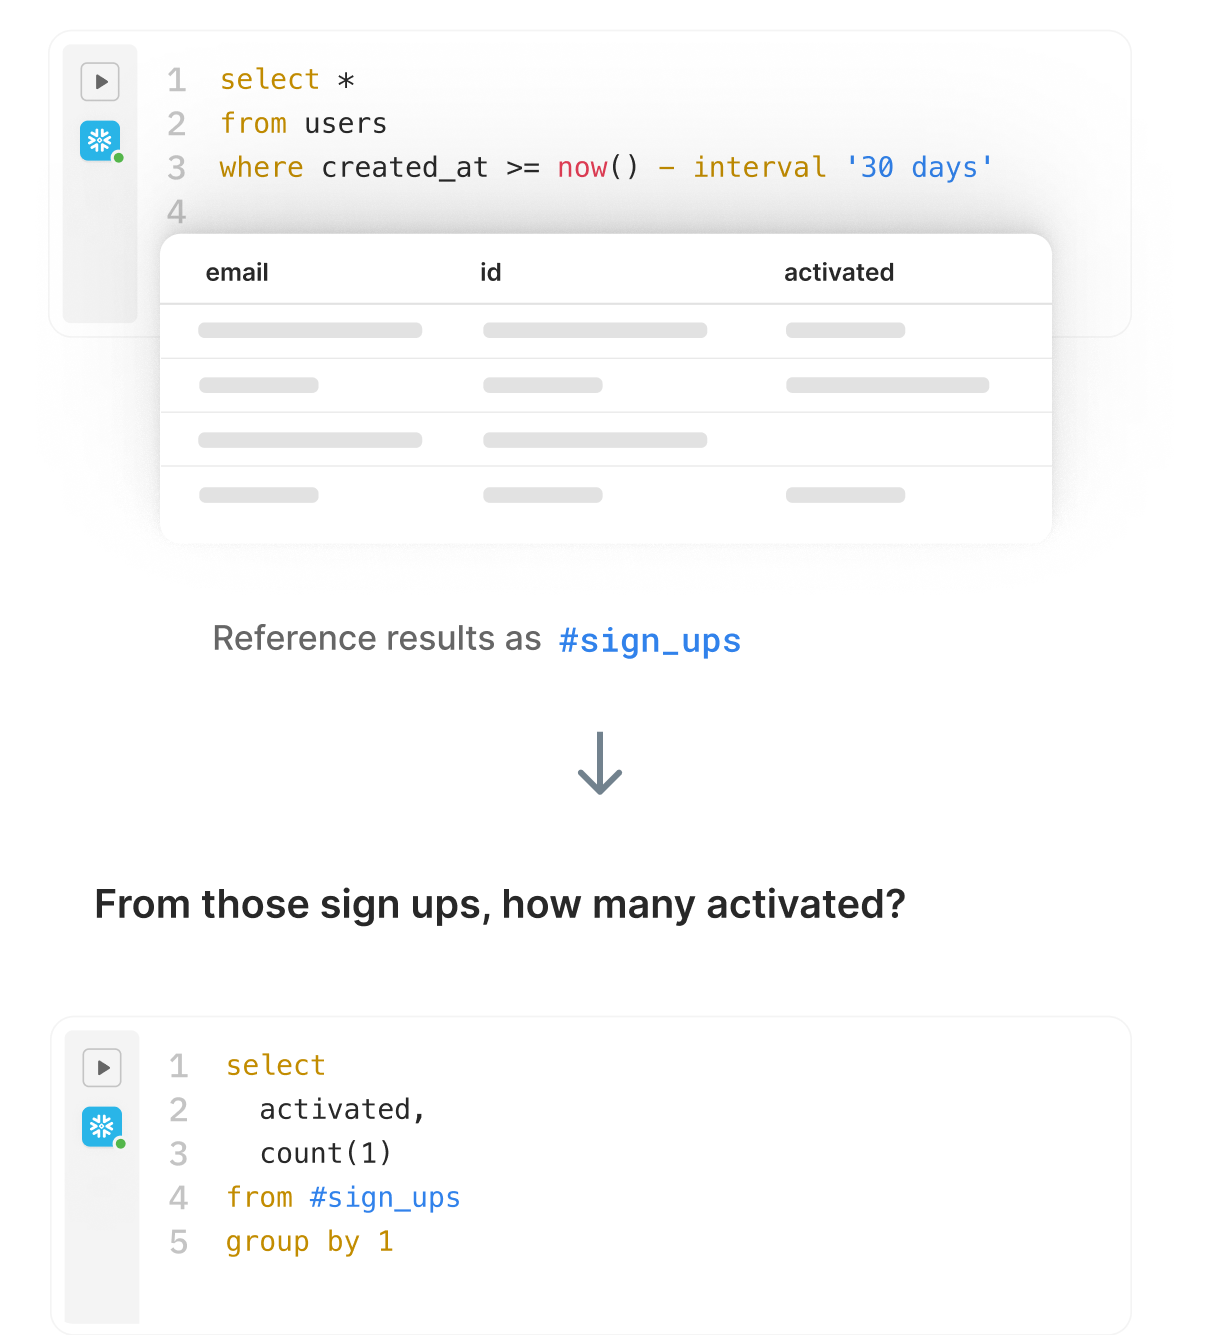
Reference the results of previous queries
Gather data in one query, then reference those results in subsequent queries to slice and dice your data.
Share your story
Easily share your notebook URL with others.