Running a Funnel Analysis in SQL

You’ve spent a ton of effort / money to get users to explore your product. Are there chasms in your product where visitors simply fall off?
A funnel analysis gives clarity.
Why SQL?
We initially used Google Analytics for funnel analyses. It was... lacking.
We wanted to talk to users who fell off at a particular step... but we couldn’t since Google Analytics aggregates and anonymizes. We wanted to see a funnel for our most qualified users by passing in an internally calculated metric like a Lead Score. No luck.
SQL empowers you to get a 360° understanding of how customers use your product.
SQL you can copy / paste
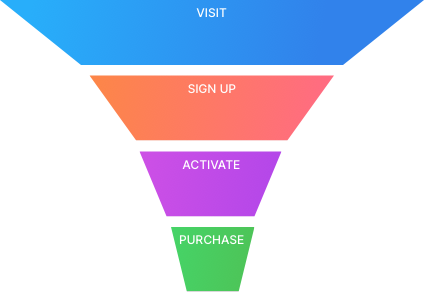
First step: define the stages of your funnel
Inspired by the Pirate Metrics framework, in this example, we’ll segment our funnel steps as:
Second step: follow the same users through your funnel
Many other funnel analysis templates make a big mistake: they independently calculate each step, then lump them all together.
To illustrate the problem, you could have activations in July 2020 who first visited and signed up in September 2019.
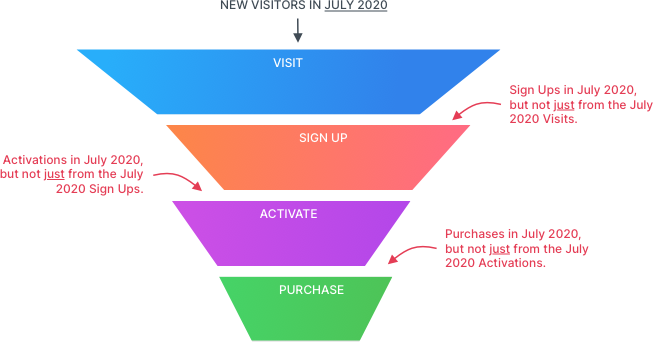
These 2019 users experienced a totally different landing page or product -- a different funnel altogether! If you include these historical user actions, you run the risk of artificially inflating all your funnel conversion metrics. That can be a big problem if you’re using these conversion metrics in any future models.
Here's the query
If you have an events table with a timestamp, event_name, and user_id you can use the queries below with little modification.
This query looks complex, but we break it down inline:
-- VISITORS (DEFINES THE GROUP WE FOLLOW THROUGH THE FUNNEL)
with visitors as (
  select
    distinct_id, -- effectively a user_id
    min(time) as min_time -- gets the earliest Visit for each person
  from events
  where name = 'View Landing Page'
  group by 1
  having min(time) between '2020-04-01' and '2020-05-31' -- selects people whose first visit is in this time range
),

-- SIGN-UPS (FROM THE VISITORS ABOVE)
sign_ups as (
  select
    distinct e.distinct_id
  from visitors v -- ensures we only look at the Visitors defined above
  inner join events e on e.distinct_id = v.distinct_id
  where e.name = 'Sign Up' -- an internal event that defines sign-up
),

-- ACTIVATIONS (FROM THE SIGN-UPS ABOVE)
activations as (
  select
    distinct e.distinct_id
  from sign_ups s  -- ensures we only look at the Signups defined above
  inner join events e on e.distinct_id = s.distinct_id
  where e.name = 'New Canvas'
),

-- PURCHASES (FROM THE ACTIVATIONS ABOVE)
purchases as (
  select
    distinct e.distinct_id
  from activations a  -- ensures we only look at the Activations defined above
  inner join events e on e.distinct_id = a.distinct_id
  where e.name = 'Start Subscription'
)

select 'Visit' as step, COUNT(*) from visitors
  union -- joins the output of queries together (as long as they have the same columns)
select 'Sign Up' as step, COUNT(*) from sign_ups
  union
select 'Activate' as step, COUNT(*) from activations
  union
select 'Purchase' as step, COUNT(*) from purchases
order by count desc -- applies to the whole result set
;
Output:
| Step        | Count |
|-------------|-------|
| Visit       | 593   |
| Sign Up     | 142   |
| Activations | 127   |
| Purchases   | 6     |
Calculating drop-off at each step
You’ll likely want to know where the drop-off between steps is the worst. You can use the lag() function (docs) to compare the output of each step against the one prior:
-- query is identical to that above. We add a CTE called steps so we can do one further analysis
steps as (
  select 'Visit' as step, COUNT(*) from visitors
    union
   select 'Sign Up' as step, COUNT(*) from sign_ups
    union
  select 'Activate' as step, COUNT(*) from activations
    union
  select 'Purchase' as step, COUNT(*) from purchases
  order by count desc
)
select
  step,
  count,
  lag(count, 1) over (),
from steps;
Output:
| Step     | Count | lag |
|----------|-------|-----|
| Visit    | 593   |     |
| Sign Up  | 142   | 593 |
| Activate | 127   | 142 |
| Purchase | 6     | 127 |
We add a line below to calculate 1 - (Count / lag) for each step to get drop_off. To illustrate, for the Sign Up step: 1 - (142 / 593) = 0.76, i.e. a 76% drop off.
-- query is identical to above, just adding one extra line to calculate ∆ between Lag and Count columns of each step
select
  step,
  count,
  lag(count, 1) over (),
  round((1.0 - count::numeric/lag(count, 1) over ()),2) as drop_off
from steps;
Output:
| Step     | Count | lag | drop_off |
|----------|-------|-----|----------|
| Visit    | 593   |     |          |
| Sign Up  | 142   | 593 | 0.76     |
| Activate | 127   | 142 | 0.11     |
| Purchase | 6     | 127 | 0.95     |
This query suggests we focus on the drop-off from Visit to Sign Up. The drop-off is substantial and it's near the top of our funnel. Any improvement at the top of the funnel positively impacts all down-funnel metrics.
Try it yourself?
Run this template against our sample database that mirrors real startup data. See the connection credentials, then connect in PopSQL.
