How to Generate Series to Avoid Gaps in Data in BigQuery
If you're grouping by time in BigQuery and don't want gaps in your data, you need to generate a series of time values. In the example below, we're generating a series of timestamps that increment by the hour. In these examples, the data type of the schema is a timestamp.
First we generate our series with no gaps:
select *
from UNNEST(GENERATE_TIMESTAMP_ARRAY('2015-10-01', '2015-10-03', INTERVAL 1 HOUR)) AS hour
| hour |
|-------------------------|
| 2015-10-01 00:00:00 UTC |
| 2015-10-01 01:00:00 UTC |
| 2015-10-01 02:00:00 UTC |
| 2015-10-01 03:00:00 UTC |
| 2015-10-01 04:00:00 UTC |
| 2015-10-01 05:00:00 UTC |
...Note: BigQuery allows you to generate ~1 million intervals with this method. If your schema is datetime, simply use GENERATE_DATETIME_ARRAY. For date, use GENERATE_DATE_ARRAY.
Next use a common table expression to create a table that contains the gapless series we created above. We'll call it hours 🧐. We can now left join any table with "gappy" time series data to our gapless hours table:
with hours as (
  select *
  from UNNEST(GENERATE_TIMESTAMP_ARRAY('2015-10-01', '2015-10-03', INTERVAL 1 HOUR)) AS hour
)

select
  hours.hour,
  COUNT(id)
from hours
left join `bigquery-public-data.hacker_news.comments` on timestamp_trunc(`bigquery-public-data.hacker_news.comments`.time_ts,hour) = hours.hour
group by 1
order by 1;
We're using a BigQuery public dataset on Hacker News in our example above, so you can follow along. It only takes 5 minutes to get started with BigQuery in PopSQL.
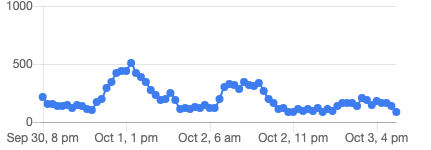
Not only does PopSQL allow you to share queries with your teammates, but it autogenerates charts to save you even more time. Here's the results from the query above:

Isn't exploring BigQuery exhilarating? 🎢