How to Measure Cohort Retention in BigQuery

With some simple visitor data, you can tell how you're retaining your customers on a month by month basis. That's super valuable!
You can follow along at home, we'll use one of BigQuery's public datasets (details below). It's real visitor data from the Google Store in 2017.
If you want to use your own data, the queries in this guide can be converted to work with your favorite SQL dialect. All your data needs is a timestamp of when your users visit your site and a visitor ID to track them.
What This Analysis Will Produce
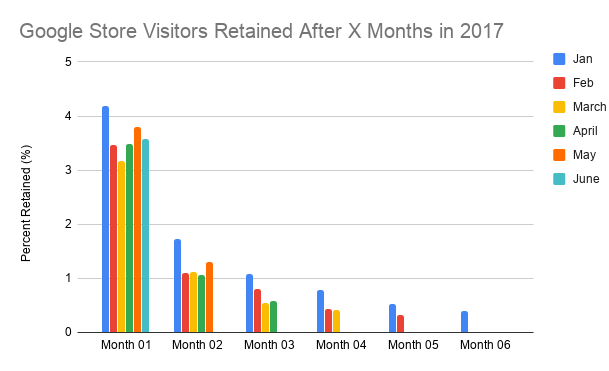
Here's a graph showing what percent of users came back to the Google Store after visiting for the first time. It's grouped by what month they first visited and shows what percent remain after subsequent months.
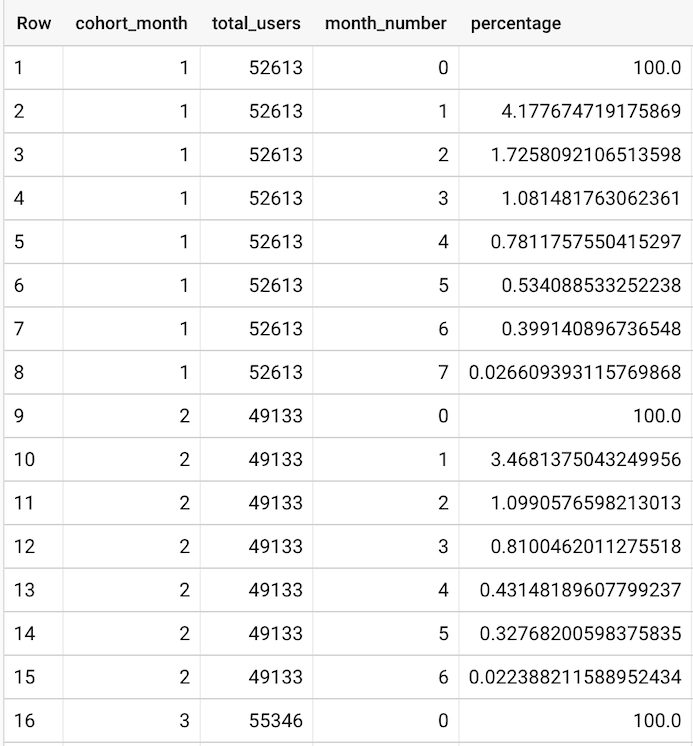
And here are the cohort sizes, for the more detail oriented folks.
Cohort Retention Definition
What's a cohort? Essentially a group of people.
How are we grouping our customers? I've decided to group them by the month that they visited the site.
How do we know if we retained a user? We can know if they visit the site again in a subsequent month. For example if they visited in June then again in July, they were retained. But the months are independent — They could visit in June, and not show up again until August. We wouldn't count July, but would count August.
Cohort Retention Framework
- Group all our users into cohorts based on the month they first came to the store and count the total.
- Count how many users came back each month, starting from their cohort month.
- Calculate the percentage of cohort remaining after each month
BigQuery Data
Feel free to skip this section if you don't want to use the example data from BigQuery.
BigQuery has a large number of public datasets and Google Store Analytics from 2017 is one of them.
You'll need to make a Google Cloud Platform account, create a project, and add the public dataset to your project. Next, since we can't edit the public dataset, you'll need to copy the data from the public dataset to your project.
SQL
In BigQuery, I named my project "Cohort Analysis" and named my duplicate table "Google Store Analytics" so you'll see the prefix cohort-analysis-284422.Google_Store_Analytics often in this article. To follow along, replace this prefix with the name of your project and table in BigQuery.
For each part, I'll also be creating views to make the queries reusable and easier to work with!
Part One: Find Our Cohorts
First we find out the first time each customer visited the site this year and create a view so that we can reference this query later.
create view `cohort-analysis-284422.Google_Store_Analytics.cohort` as
select
  extract(date from timestamp_seconds(min(visitStartTime))) as cohort_month,
  fullVisitorId
from `cohort-analysis-284422.Google_Store_Analytics.ga_sessions_2017*`
group by fullVisitorId
Example Results:
| cohort_month | fullVisitorId |
|--------------|---------------------|
| 2017-05-12 | 0206596068278667912 |
| 2017-05-12 | 3310123534725675314 |
| 2017-04-25 | 3153380067864919818 |
| 2017-06-23 | 1216639212736323098 |We also find out the size of each cohort by counting the number of unique ids that show up for the first time in a month.
create view `cohort-analysis-284422.Google_Store_Analytics.cohort_size` as
select
  extract(month from cohort_month) as cohort_month,
  count(1) as num_users
from `cohort-analysis-284422.Google_Store_Analytics.cohort`
group by cohort_month
Example Results:
| cohort_month | num_users |
|--------------|-----------|
| 1 | 52613 |
| 2 | 49133 |
| 3 | 55346 |
| 4 | 52873 |Part Two: Measure Activity After Cohort Month
Next, we find what months there's been activity after their cohort month. For example If their cohort was January and they came to the site on February, then it notes activity on month one — one month after their cohort month.
create view `cohort-analysis-284422.Google_Store_Analytics.user_activities` as
select
  date_diff(
    extract(date from timestamp_seconds(GA.visitStartTime)),
    C.cohort_month,
    MONTH
  ) as month_number,
  GA.fullVisitorId
from `cohort-analysis-284422.Google_Store_Analytics.ga_sessions_2017*` GA
left join `cohort-analysis-284422.Google_Store_Analytics.cohort` C on GA.fullVisitorId = C.fullVisitorId
group by 2, 1
Example Results:
| month_number | fullVisitorId |
|--------------|---------------------|
| 0 | 7868243379843705173 |
| 0 | 5418231530547311489 |
| 0 | 4704421551407457903 |Now we count how many users were retained in each month after their cohort month and name it retention_table.
create view `cohort-analysis-284422.Google_Store_Analytics.retention_table` as
select
	extract(MONTH from C.cohort_month) as cohort_month,
	A.month_number,
	count(1) as num_users
from `cohort-analysis-284422.Google_Store_Analytics.user_activities` A
left join `cohort-analysis-284422.Google_Store_Analytics.cohort` C on A.fullVisitorId = C.fullVisitorId
group by 1, 2
Example Results:
| cohort_month | month_number | num_users |
|--------------|--------------|-----------|
| 1 | 0 | 52613 |
| 1 | 1 | 2198 |
| 1 | 2 | 908 |Final: Divide the Number of Remaining Users by the Cohort Size
Finally we get the cohort percent retention after each month.
create view `cohort-analysis-284422.Google_Store_Analytics.final` as
select
  R.cohort_month,
  S.num_users as total_users,
  R.month_number,
  cast(R.num_users as float64) * 100 / S.num_users as percentage
from `cohort-analysis-284422.Google_Store_Analytics.retention_table` R
left join `cohort-analysis-284422.Google_Store_Analytics.cohort_size` S on R.cohort_month = S.cohort_month
where R.cohort_month is not null
order by 1, 3
You should end up with a final result that looks like this.
With this data I also made this bar graph to show the drop off in users each month.
Conclusion
Again, figuring out how you're retaining your users is super valuable! You can see in this chart that the January cohort is consistently more retained than other cohorts. This could be for various reasons and knowing why could help your business capitalize on this fact.
Future Use and Modifications
Anyone who has used Google Analytics on their site knows that this cohort analysis is immediately available to them for free. But this manual method is much more flexible!
Imagine that you also want to find retention numbers for customers who have paid for a product? What about customers who have used your latest feature or were referred by a friend? There are tons of insights you can get from visitor data which makes this data super powerful for guiding your business.
Thank you for reading and I'll see you in the next article! ✌🏾
Thanks again to our guest author, Abdi Mohamud!

