Detecting Skewness in a Dataset in SQL
Note: this guide provides SQL queries that assume you’re familiar with statistics. Need a stats refresher? See our recommended guides below.
Extreme outliers or skewed data can result in faulty conclusions.
Why SQL?
Startups can perform statistical analyses extremely quickly with SQL.
A.I. gets all the attention, but arguably more business decisions rely on simple statistics.
SQL you can copy / paste
This query shows the shape of your data:
select
   min(amount_cents),
   percentile_cont(0.25) within group (order by amount_cents asc) as p25,
   percentile_cont(0.50) within group (order by amount_cents asc) as median,
   avg(amount_cents) as mean,
   percentile_cont(0.75) within group (order by amount_cents asc) as p75,
   max(amount_cents),
   stddev(amount_cents)
from transactions;
Sample Output:
| min | p25    | median | avg    | p75    | max      | stddev |
|-----|--------|--------|--------|--------|----------|--------|
| 42  | 114789 | 167051 | 350468 | 310639 | 10500000 | 723776 |
This data set is skewed a bit to the right. The median is closer to the third quartile (p75) than to the first quartile (p25). Looks like there may even be some strong outliers (e.g. max is very far from average and the third quartile). 🤓
SQL can distill all this “data divining” into a simple metric. Pearson's Coefficient of Skewness (one of many metrics for detecting "skewy" data) can be easily calculated with our query results from above:
with stats as (
   select
     min(amount_cents),
     percentile_cont(0.25) within group (order by amount_cents asc) as p25,
     percentile_cont(0.50) within group (order by amount_cents asc) as median,
     avg(amount_cents) as mean,
     percentile_cont(0.75) within group (order by amount_cents asc) as p75,
     max(amount_cents),
     stddev(amount_cents)
  from transactions
)
select
  (3 * (mean - median))/stddev as pearson_coeff
from stats;
Sample Output:
| pearson_coeff |
|---------------|
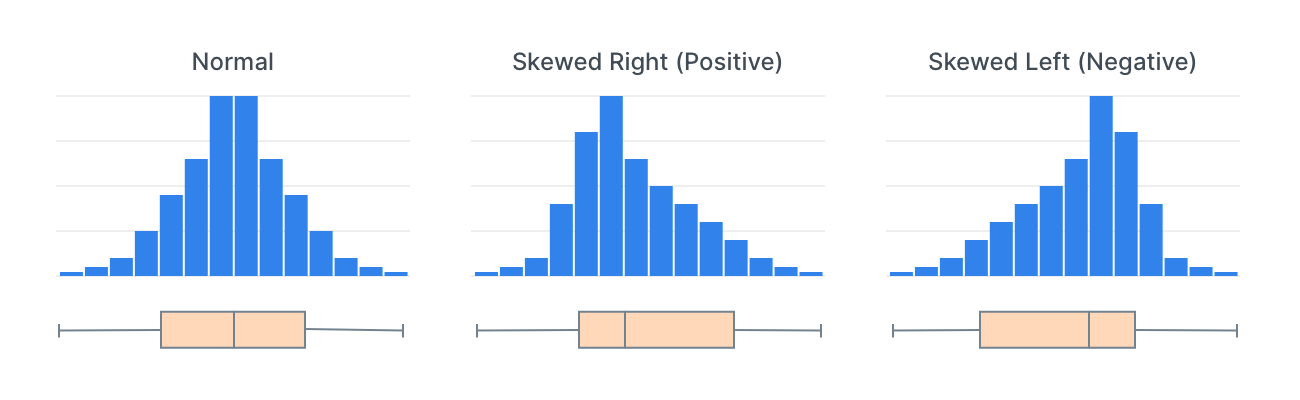
| 0.76 |Simple rules for interpreting output:
- 0 = no skewness at all.
- Large negative value = skewed left, aka negatively skewed.
- Large positive value = skewed right, aka positively skewed.
If you’re more visual, you can easily create histograms with your data in SQL.
Try it yourself?
Run this template against our sample database that mirrors real startup data. See the connection credentials, then connect in PopSQL.
Bonus Content
- Need to freshen up on Statistics?
- Short and Sweet YouTube video (30 min)
- The Old Fashioned Way (an enjoyable textbook)
- Top-Selling, Top-Rated Udemy course (paid)
- Check out all of PostgreSQL's statistical functions
