Monitoring a Feature Launch with SQL

You gotta have visibility on any newly launched features. You can't fly blind or “test on users”.
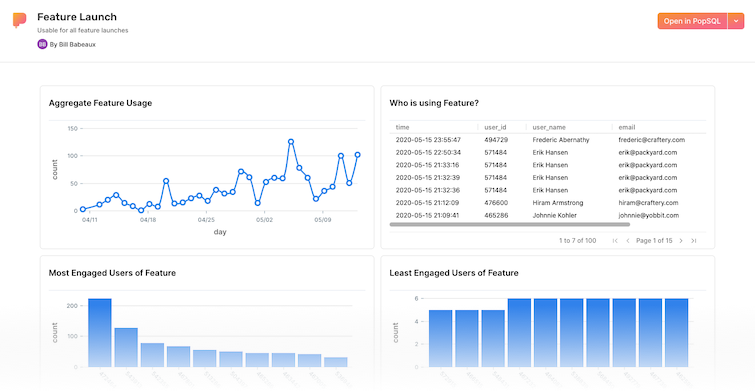
Fortunately, you can make a feature launch dashboard in PopSQL in under 20 minutes. Here's a preview:
Why SQL?
Our team comes from Uber, Instacart, Segment, InVision, and Auth0. We know that even large teams face analytics challenges like:
- deadlines that sneak up;
- your team is short an analyst;
- the data eng team has a 2 week backlog and can’t get your (experimental) data into your BI tool (which requires heavy data instrumentation 😬 ); etc.
SQL you can copy / paste
Note: these queries give high-level visibility. We’re writing a SQL template on how to statistically measure if a feature has met the predicted success criteria with no degradation in secondary metrics (aka the gold standard).
Quick links:
- Is anybody using the feature?
- Who is using it?
- How much are they using it?
- How exactly are they using it?
- How does use compare to similar features?
- Has anything gone wrong?
Is anybody using the feature?
If you have a users table and an events table with a timestamp and event_name , you can use the queries below with little modification.
select
  date_trunc('day',time) as day -- or week, month
  count(*)
from events
where time > '2020-03-28' and time < '2020-05-15' --launch date
  and name = '{{feature}}'
group by 1
order by 1;
Sample Output (visualized in PopSQL):
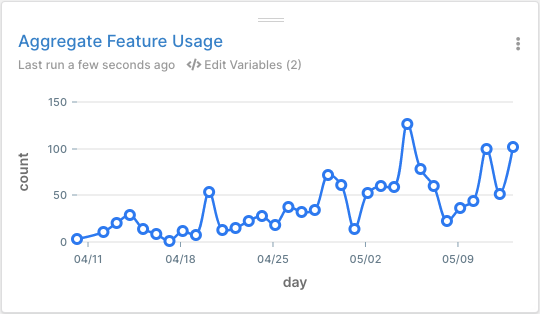
Great! People are actually using this feature.
Who is using it?
Here's a simple way to find the last 100 interactions with your feature:
select
  distinct
  e.time,
  u.id as user_id,
  concat(u.first_name, ' ', u.last_name) as user_name,
  u.email,
  u.created_at as user_created_at
from events e
inner join users u on u.id = e.user_id
where e.time >= '2020-03-28' --launch date
  and e.name = '{{feature}}'
order by e.time desc
limit 100;
Sample Output:
| time                | user_id | name               | email                 | user_created_at     |
|---------------------|---------|--------------------|-----------------------|---------------------|
| 2020-05-15 23:55:47 | 494729  | Frederic Abernathy | frederic@craftery.com | 2019-03-04 21:25:04 |
| 2020-05-15 22:50:34 | 571484  | Erik Hansen        | erik@packyard.com     | 2020-04-17 00:12:50 |
| ...                 | ...     | ...                | ...                   | ...                 |
Pro tip: add customer attributes (e.g. company size, role) to spot trends in what kind of users are adopting the feature. You can even enrich users/leads with Clearbit to go deeper (a topic for a future template!).
How much are they using it?
To find the most engaged users of the feature:
select
  user_id,
  COUNT(1)
from events
where name = '{{feature}}'
group by 1
order by 2 desc
limit 10;
The least engaged users of the feature:
select
  user_id,
  COUNT(1)
from events
where name = '{{feature}}'
group by 1
order by 2 asc
limit 10;
And to show all users (showing intensity of use too):
with event_data as (
  select
    user_id as user_id,
    min(time) as first_time,
    max(time) as last_time,
    round(((extract(epoch from max(time)) - extract(epoch from min(time))) / 86400)::decimal, 1) as days_elapsed,
    count(1)
  from events
  where name = '{{feature}}'
  group by 1
)

select
  *,
  ROUND((count / days_elapsed),1) as avg_use_per_day
from event_data
where count > 0 -- to prevent dividing by 0
  and days_elapsed > 0 -- to prevent dividing by 0
order by 6 desc -- sort by avg_use_per_day;
Sample Outputs (visualized in PopSQL):
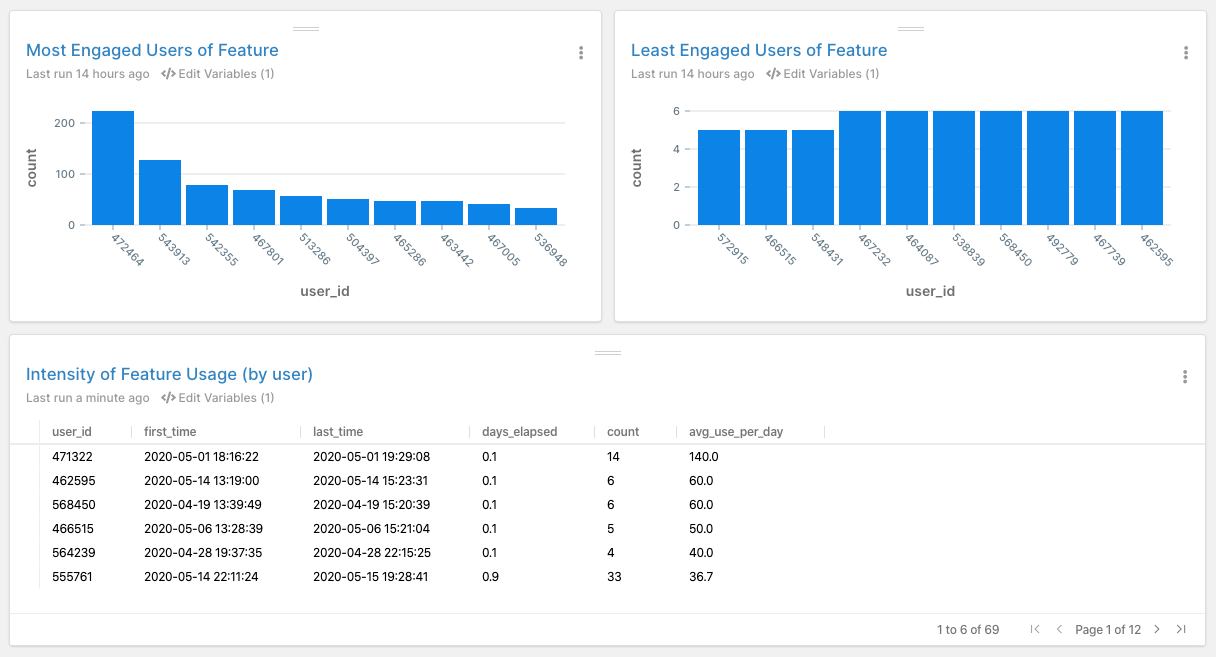
Talk to the extremes. For the barely engaged with the feature, ask them what’s lacking. For the heavily engaged, ask them what they’re loving.
How exactly are they using it?
Here you can see a stream of events through your product for a particular user:
select
  time,
  name,
  user_id
from events
where user_id = {{user_id}}
order by time desc;
Sample Output:
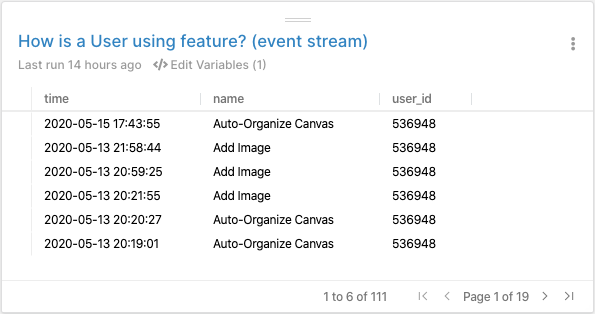
What's even better than this query? Talking to your customers! Offer a $25 gift card (Starbucks, Amazon, etc) for 25 minutes of their time. You’ll get much better insight. We've even included a list of questions to ask.
How does use compare to similar features?
See our post on Comparing Feature Usage for the full overview.
select
  date_trunc('week',time),  -- or day, month, etc
  name,
  count(1)
from events
where name in ('Add Image','Delete Image','Auto-Organize Canvas','New Canvas','Share Canvas') -- here we select a few relevant features
group by 1,2;
Sample Output (visualized in PopSQL):
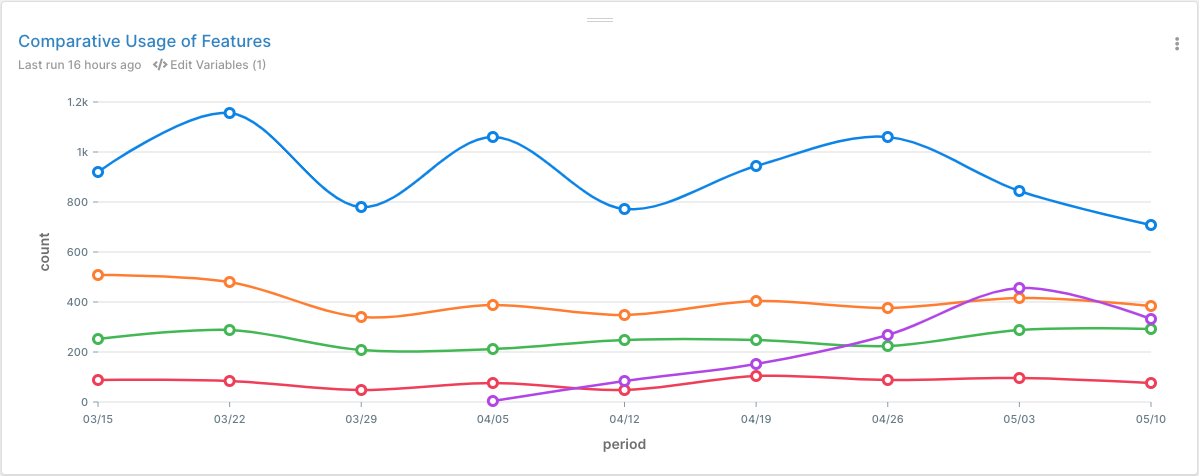
Our new feature (line 🟣 ) is growing in usage. That dip in the latest week is curious, though...
Has anything gone wrong?
For small startups, keep an eye on error logs, beta users, and support tickets. You'd be surprised how readily visible spikes / anomalies are when you've visualized your data.
select
  date_trunc(day,created_at) as day,
  count(*)
from tickets
group by 1
order by 1;
Sample Output (visualized in PopSQL):
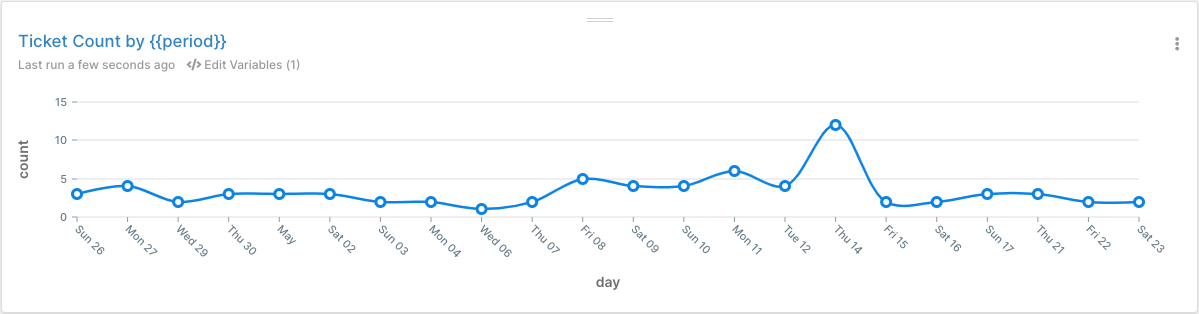
That spike is anomalous and corresponds with the dip in feature usage above.
Try it yourself?
Run this template against our sample database that mirrors real startup data. See the connection credentials, then connect in PopSQL.
Bonus Content
As we mentioned above, here are easy questions you can ask your users about a newly launched feature:
- What’s your use case for this feature?
- What type of people on your team would most benefit from this feature?
- What roles wouldn’t benefit or use this feature?
- How are you using this feature? (What is your workflow?)
- What is the main benefit you receive from this feature?
- What do you dislike about this feature?
- What’s the main thing we can improve about this feature for you?
- How would you feel if you could no longer use this feature? (Very disappointed, Somewhat disappointed, or Not disappointed)
- What would you use instead of this feature?
- What other tools did you look into to solve this use case?
