Ranking the Most Used Features in Your Product

Which features in your product do customers use the most? As you release new features, does the relative usage of each feature change?
Why SQL?
SQL is the lingua franca for data at startups.
Sure, analytics tools like Mixpanel, Amplitude, etc can show a part of the picture. But you’ll need SQL to tie feature usage data to other data sources (say financial data for revenue attribution).
SQL you can copy / paste
If you have an events table with a timestamp and event_name you can use the queries below with little modification.
select
 date_trunc('week',time),  -- or day, month, etc
 name,
 count(1)
from events
where name in ('Add Image','Delete Image','Auto-Organize Canvas','New Canvas','Share Canvas') -- here we select a few relevant features
group by 1,2;
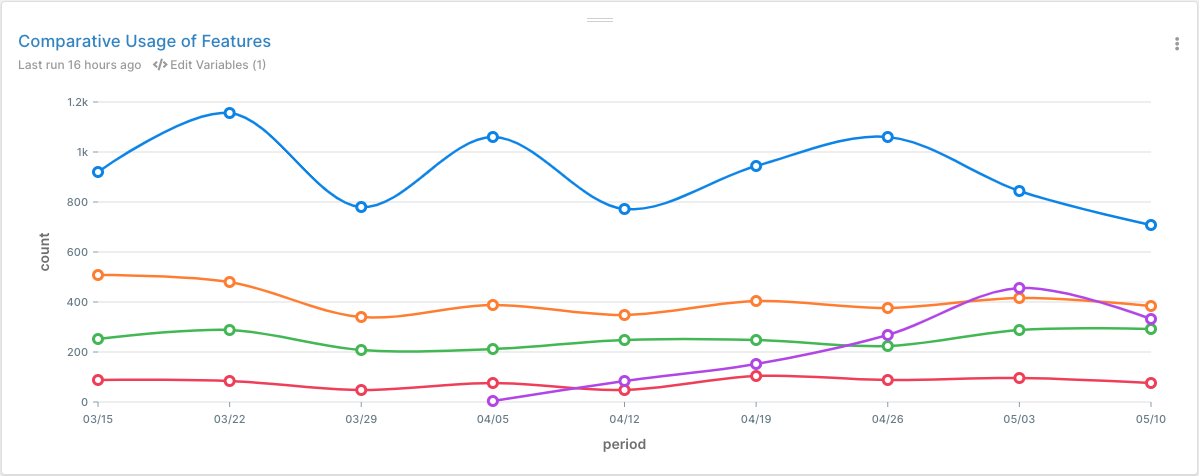
Sample Output (visualized in PopSQL):

Looks like Add Image is the most common feature used.
Interesting that the new Auto-Organize Canvas feature is increasing in popularity. Check out our template on how monitor feature launches in SQL.
Try it yourself?
Run this template against our sample database that mirrors real startup data. See the connection credentials, then connect in PopSQL.
Pro Tips
- Usage ≠ Value Conferred
Some actions are done infrequently, but are the core reason someone has purchased your product. E.g. creating a dashboard may just be done once, but it’s crucial for monitoring KPIs.
- Usage ≠ Love
Just because someone uses a feature a ton, doesn’t necessarily mean they love that feature. We once talked to a power user of PopSQL who was off the charts for the number of queries he ran. Turns out, though, he was powering a sales workflow and so was pulling customer-specific reports for numerous salespeople daily. That's why we built Scheduled Queries.
- Talk to your power users often
How to find your most engaged users.
Spread the word
TweetReady for a modern SQL editor?
